
New in Product: Turning Awareness Data Into Clear Security Insights
Security awareness programs only create value when you can demonstrate real behavior change, not just course completion.
But for many teams, turning awareness data into clear insights is still difficult. Metrics are scattered across reports, behavioral trends are hard to interpret, and proving impact to stakeholders often requires manual analysis.
Our latest product update is designed to strip away the guesswork. We’ve focused on making your analytics intuitive and your reporting automated, allowing you to validate training effectiveness, track risk trends, and demonstrate progress to stakeholders.
Here is how we’re helping you turn raw data into a clear security narrative.
What’s Included in This Release?
- Module-level Awareness Assessment controls for compliance audits
- Simulation Analytics Dashboard with behavioural trend tracking
- Unified view of core simulations metrics with industry benchmarks
- Phishing template performance reporting beyond click rates
- Manager escalation emails highlighting highest-risk users
- E-learning early engagement funnel visualisation
- Tenant names included in exported reports
Greater Control Over Module Completion for Audit Requirements
Awareness Assessments can now be enabled or disabled at the individual module level.
During audits or certification processes, organizations often need to prove that employees completed a specific module in full rather than skipping ahead through an awareness assessment shortcut. With this update, administrators can enforce full module completion only where it matters most.
Training remains practical for everyday learning while still meeting strict compliance expectations.

Track How Employee Behavior Evolves Across Simulations
Security awareness programs aim to change behavior over time but tracking that progress clearly is challenging.
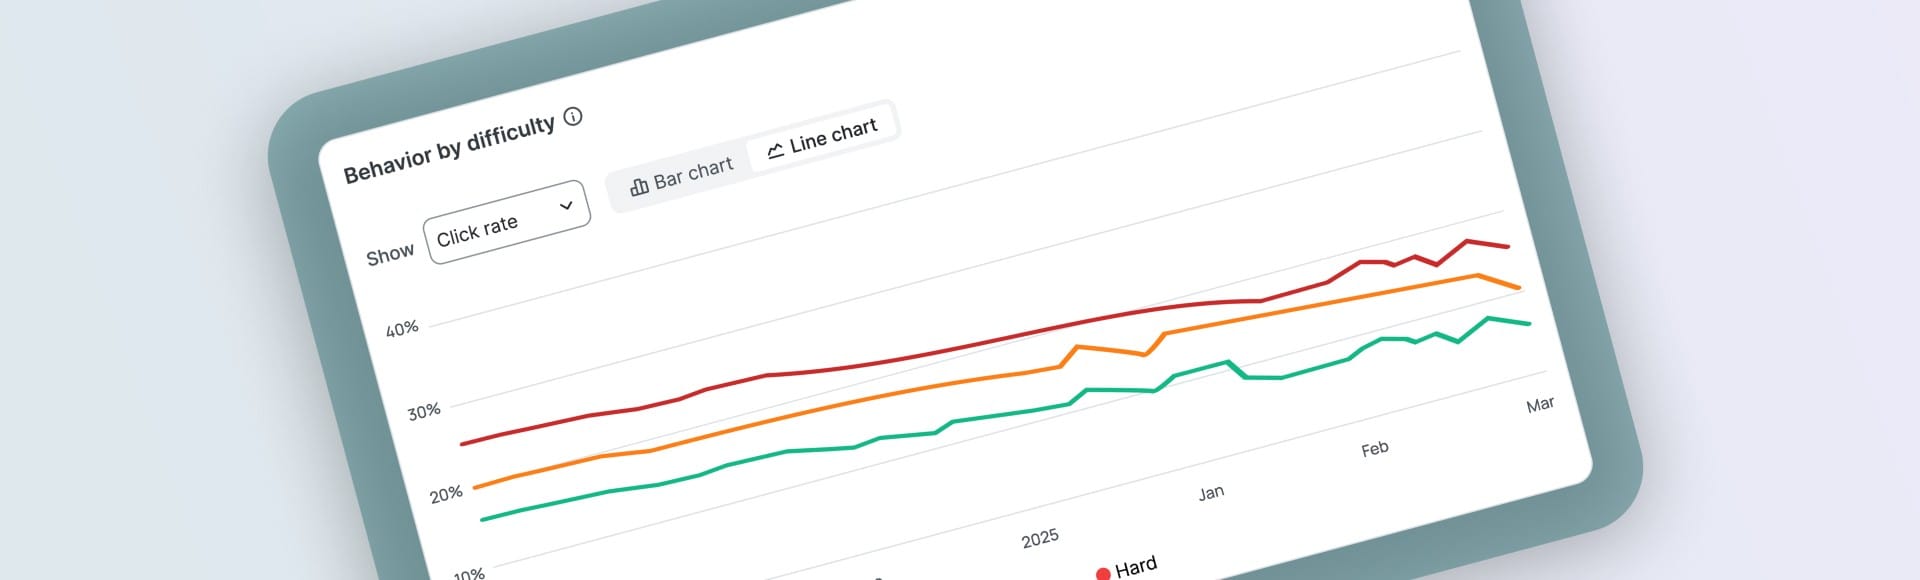
The Simulation Analytics Dashboard now shows behavioural trends over time, not just campaign-level snapshots. You can analyse click, interaction, and reporting behaviour across key dimensions such as difficulty, context, psychological tactic, and technical method, and view them over time through trend visualisations.
With the new analytics, behavioural development becomes visible directly in the platform. You can see whether harder simulations strengthen resilience, identify which attack contexts consistently cause failures, and measure defensive behaviours like reporting alongside risky actions.
The goal is simple, simulations should teach, not just test. Now you can verify that they do.
See Core Simulation Metrics in One Unified View
Alongside the trend updates, the Simulation Analytics Dashboard now combines core KPIs and historical performance in a single, unified view.
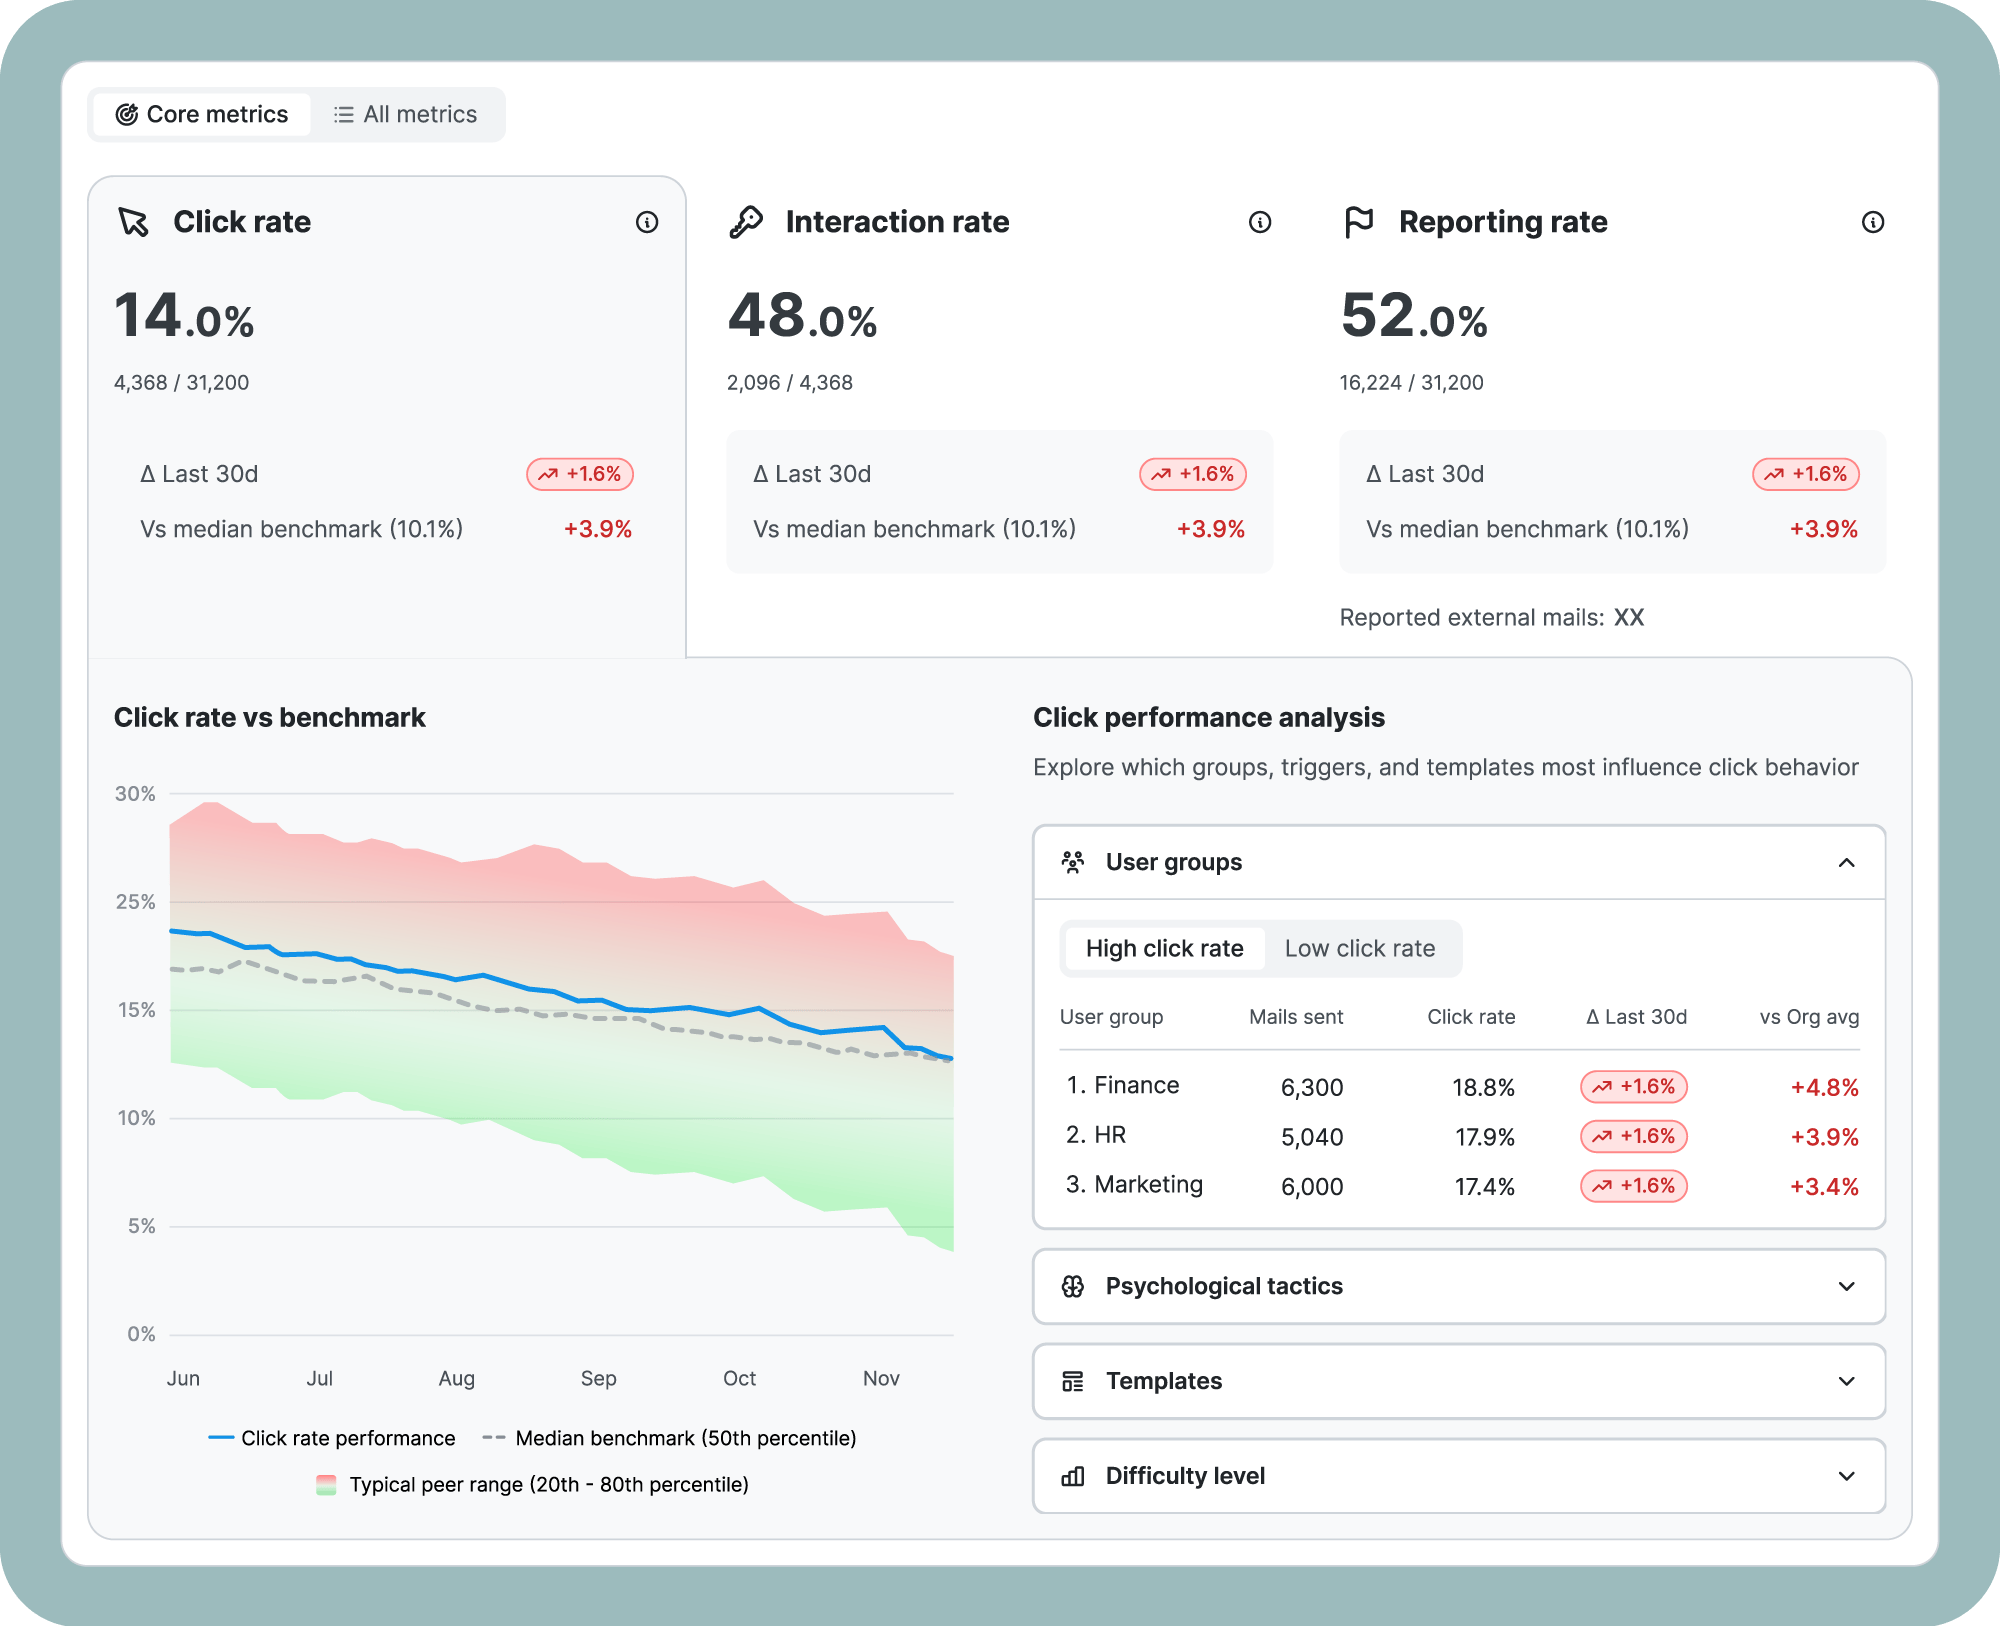
Click rate, interaction rate, and reporting rate sit together at the top, each showing your last 30 days of movement and how you compare against the median industry benchmark, right on the card. No digging, no switching between separate views.
The Click Performance Analysis panel goes further, letting you immediately spot which user groups, psychological tactics, templates, and difficulty levels are influencing phishing performance in your organisation, both the good and the bad without ever leaving the dashboard.
Understand Phishing Template Performance Beyond Click Rates
Phishing simulations provide valuable learning opportunities but evaluating template effectiveness requires more than just click rates. The dashboard now brings multiple behavioural signals together in one place, combining clicks, replies, interactions, and outcomes.
Instead of judging a template by a single metric, you can understand its full impact. A template might generate clicks but also high reporting, indicating awareness rather than failure. Another might receive a few clicks but strong engagement. These distinctions help optimise campaigns based on real learning impact rather than assumptions.

Identify High-Risk Users Earlier With Manager Escalations
Manager escalation emails now prioritize the highest-risk users first. Managers will receive a monthly overview that highlights employees who have not registered at all, alongside those who are overdue. Instead of only seeing users who started but fell behind, managers can now immediately identify those who never entered the learning journey.
Non-participation is one of the biggest compliance risks in awareness programs, and it’s often hidden until it’s too late. By surfacing unregistered users at the manager level, follow-ups happen earlier, problems get resolved faster, and administrators spend far less time chasing people down manually.

See Exactly Where Learners Drop Off in the Learning Journey
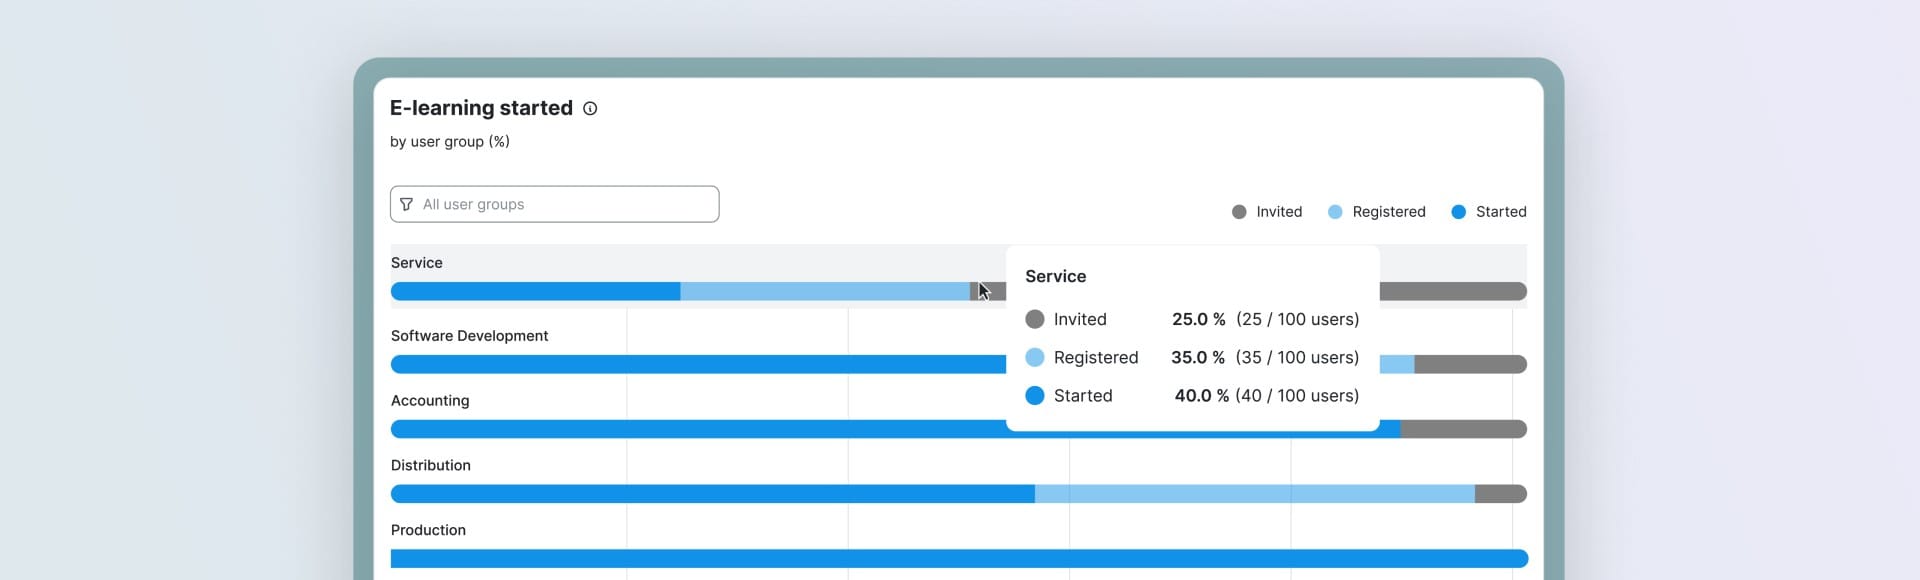
The ‘E-learning Started’ visualisation now shows the early engagement funnel more transparently. Invitation, registration, and learning start statuses are separated visually, making disengagement points immediately visible.
Because results are displayed as percentages per user group, teams can quickly compare departments and identify adoption barriers. Rather than asking whether employees are not learning, you can determine exactly where the process breaks down; access, activation, or motivation.
Cleaner Exports for Multi-Tenant Environments
For organizations managing multiple tenants, exported raw data files now automatically include the tenant name in the file name. This makes reports immediately identifiable and ready to use without renaming or opening files.
Turning Awareness Data into Actionable Security Insights
These updates do not add more dashboards, they make existing security awareness metrics easier to interpret. You can validate knowledge, monitor behavioural progress, optimise simulations, and understand engagement with less effort and fewer workarounds.
If you’d like to see how these insights look in practice, our team is happy to walk you through it.
Request a demoSoSafe Product News


Do you want to stay ahead of the cyber game?
Sign up for our newsletter to receive the latest cyber security articles, events, and resources. No spam, only content that truly matters.